0.3.3.
RTD Curves and FI Systems
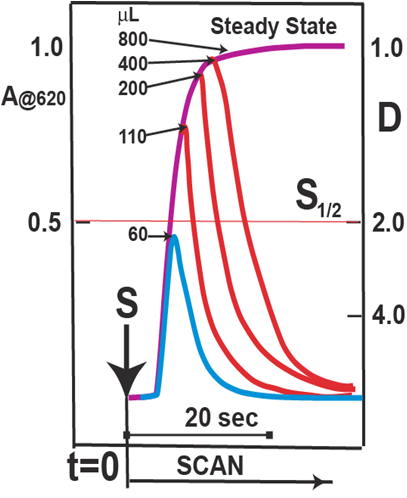
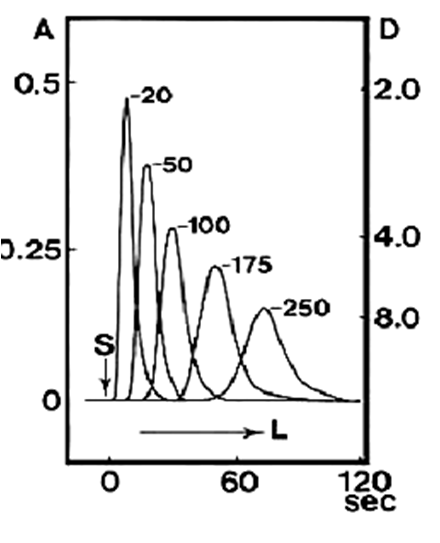
By injecting a dye into a FI or SI system, approximation to both F and C curves can be obtained (A) depending on the volume of the injected dye. The sample volume necessary to reach 50% of steady state is termed S1/2 while at least 5 S1/2 volumes are needed to reach steady state. (F-curve) By injecting dye volume equal or less that S1/2 and by increasing the length of a tubing (B) a series of C curves is obtained of decreasing peak height and increasing symmetry. It follows that:
- selection of the injected sample volume is an important parameter when designing FI/SI based assay. By increasing injected sample volume up to one S1/2 value will increase the peak height linearly. Injecting higher sample volumes will bring diminishing returns and ultimately the assay will fail for lack of mixing with reagents.
- increasing length of conduit beyond 100 cm will caouse excessive peak broadening and corresponding decrease in sampling frequency. Therefore, In order to increase residence (reaction) time it is better to slow the flow rate or to stop the flow after the mixing has been accomplished rather than to increase the length of the channel. Changing flow rates within an assay cycle is approach is the core of flow programming, also now applied to FI.
Recordings A and B were obtained using a dye (BTB) monitored at 620nm. The flow rate was 1.5mL/min, tube I.D. 0.5mm tube length is given in centimeters and injected sample volume was 60mL for graph B. (Ruzicka and Hansen 1978)


A
B